


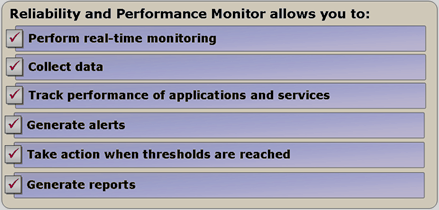
Windows Reliability and Performance Monitor tracks how applications and services affect performance, creates logs and takes action when user-defined optimal performance thresholds are exceeded.
Monitoring AD DS using Performance Monitor
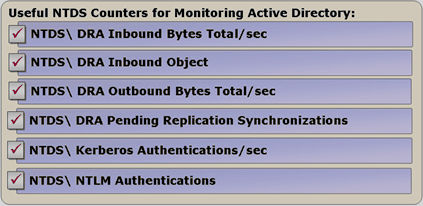
Performance Monitor tracks important AD performance indicators, helping detect and resolve minor issues before they become serious enough to cause an AD service outage.
For optimal AD operation, monitor:
|
Counter |
Description |
| NTDS\ DRA (directory replication agent) Inbound Bytes Total/sec | Shows total bytes received per second through replication. |
| NTDS\ DRA Inbound Object | Shows received replication object updates not yet applied locally. The value should be low. |
| NTDS\ DRA Outbound Bytes Total/sec | Shows total bytes sent per second. |
| NTDS\ DRA Pending Replication Synchronizations | Shows replication delay. The value should be low. |
| NTDS\ Kerberos Authentications/sec | Shows Kerberos authentications per second. |
| NTDS\ NTLM Authentications | Shows NTLM authentications per second. |
| NTDS\ DS Threads In Use | Shows threads currently used by AD DS. |
What is an AD baseline?
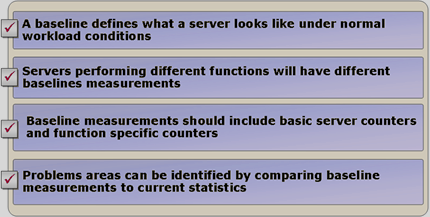
An AD baseline involves regularly monitoring system health (memory, HDD, CPU, etc.) and comparing it with earlier results to detect low disk space, excessive memory use and similar issues.
Monitoring service availability using Reliability Monitor
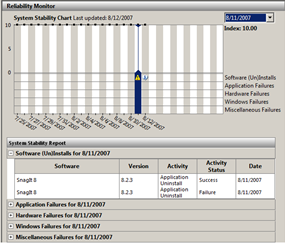
Reliability Monitor tracks service health and system stability using an index, helping identify when problems occurred. The index ranges from 10 (most stable) to 1 (least stable). With no problems it should be 10; recorded problems reduce it. After a problem is resolved, it gradually returns to 10.
Komentáře